The U.S. dollar index dropped 0.2% this morning before the inflation data due tomorrow, as inflation is expected to ease. Experts believe the U.S. economy has reached the inflationary peak which should lead to a slowdown in Fed’s rate hikes.
Meanwhile, the European central bank raised the interest rate by 75 basis points last week, cementing its rate above parity levels. On the other hand, gold prices remained above the support at 1,710 to trade at $1,712 per ounce this morning. However, gold prices dropped from $1,718 to $1,710 per ounce.
U.S. Dollar Index (USDX)
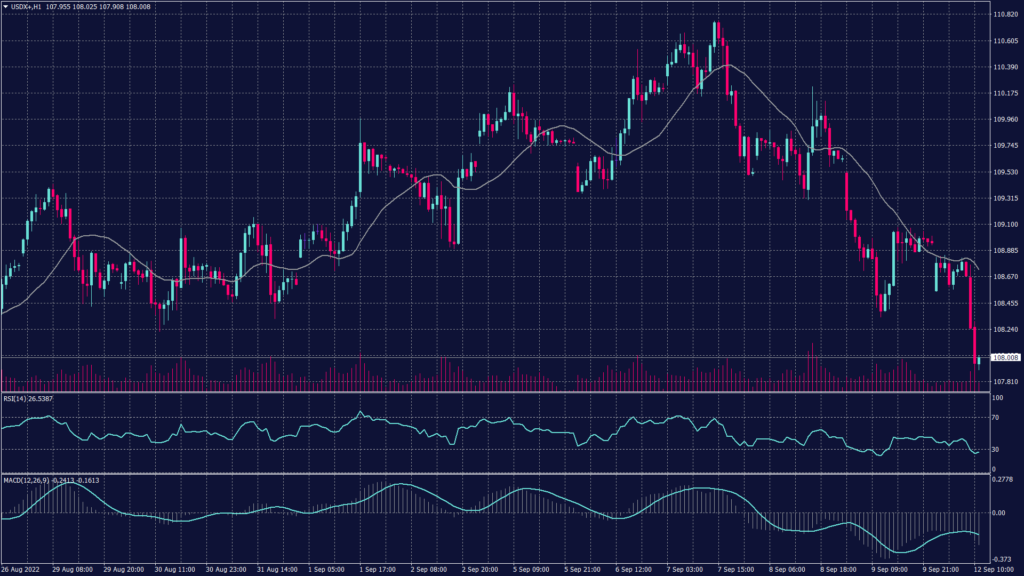
The dollar index fell 0.2% as the focus turned to U.S. CPI inflation data for August tomorrow. Inflation in the world’s largest economy is expected to have eased further from highs hit this year, a trend that may encourage the Federal Reserve to slow down its pace of interest rate hikes.
While U.S. CPI inflation did ease slightly in the past month, it remained pinned near 40-year highs by elevated food and fuel costs. But with fuel costs now easing from record highs hit earlier this year, inflation may see more signs of cooling.
The dollar index is trading at the lower band of the Bollinger bands after breaking below the support at 108.00 and signals a possibility to hit 107.50 on the hourly chart. Meanwhile, the daily chart shows a high probability of reaching 106.30. Technical indicators read a rebound as RSI is below 30 while MACD is converging at 107.85.
Pivot Point: 107.80
| SUPPORT | RESISTANCE |
| 107.50 | 108.00 |
| 107.20 | 108.40 |
| 106.30 | 108.90 |
Euro (EURUSD)
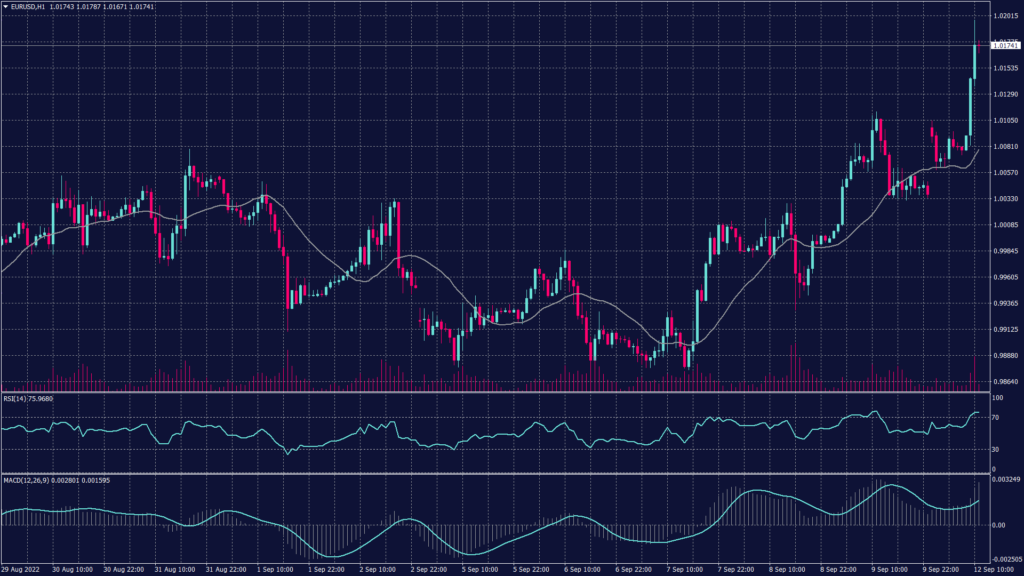
The euro jumped to a more than three-week peak versus the greenback on Monday as European Central Bank officials pushed the case for further aggressive monetary tightening. The euro leaped as high as $1.0130 early in the Asian day before last trading 0.32% stronger than Friday at $1.0079.
The common currency remains weak and moving on this moving on the downtrend in the daily chart. Meanwhile, the hourly chart shows light support at 1.008 which might not hold against heavy bearish pressure. However, the pair hit the resistance at 1.0190 which drove the technical indicators to a reverse level.
Pivot Point: 1.0190
| SUPPORT | RESISTANCE |
| 0.9980 | 1.0080 |
| 0.9950 | 1.0100 |
| 0.9870 | 1.0200 |
Spot Gold (XAUUSD)
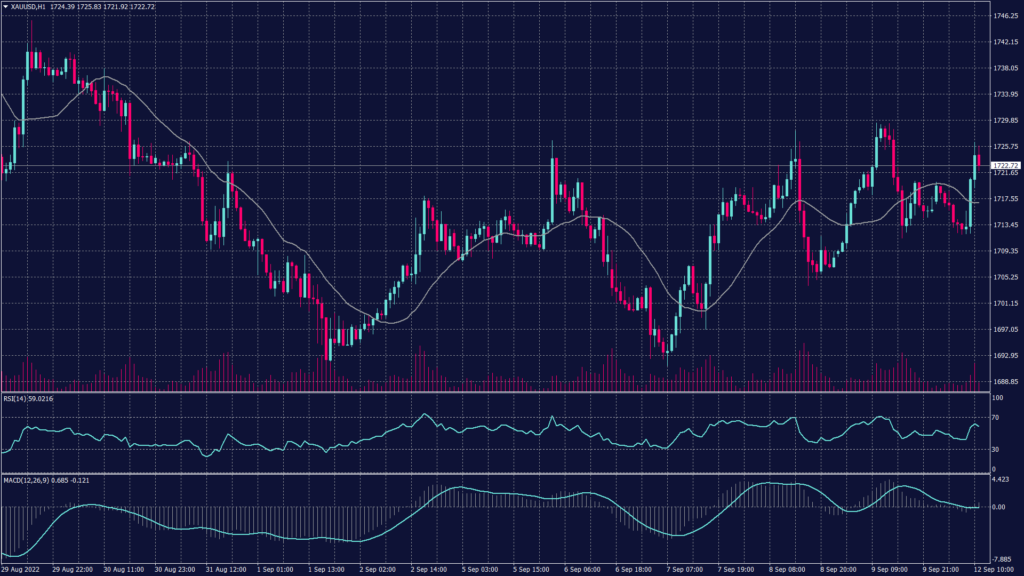
Gold prices inched higher on Monday, retaining mild gains from last week as the dollar fell further from 20-year highs ahead of key U.S. inflation data this week. Spot gold prices rose 0.1% to $1,718.83 an ounce, while gold futures edged up to $1,730.0 an ounce.
Spot gold is showing a double bottom formation on the hourly chart which is yet to be confirmed on the daily chart. However, if gold prices penetrated the levels of 1,726, they will head to 1,740 which will be a possible platform for a new rise.
Pivot Point: 1,725
| SUPPORT | RESISTANCE |
| 1,710 | 1,737 |
| 1,705 | 1,740 |
| 1,680 | 1,742 |
West Texas Crude (USOUSD)
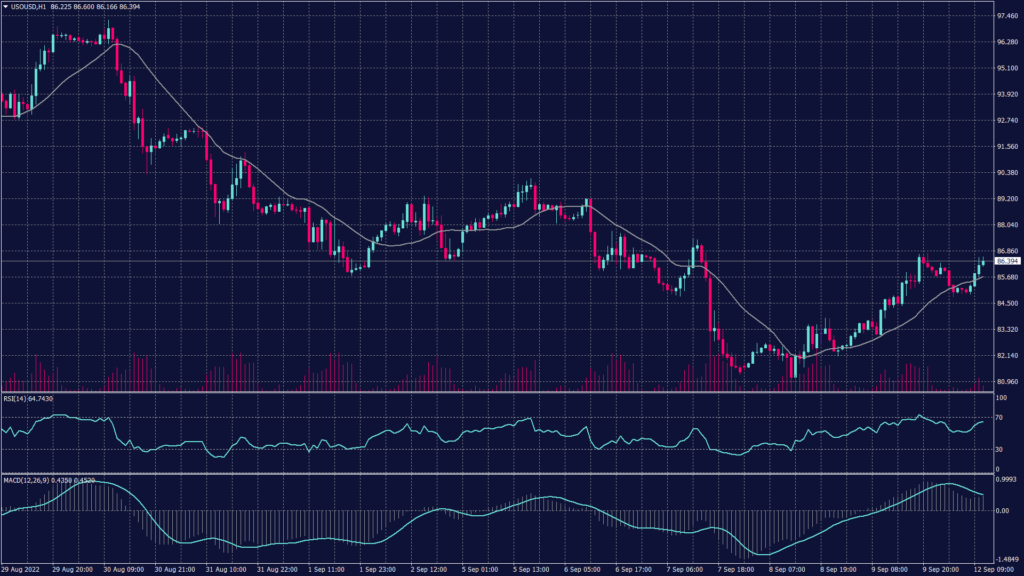
London-traded Brent oil futures fell 0.3% to $92.14 a barrel, while West Texas Intermediate futures fell 0.9% to $86.05 a barrel. Both contracts settled slightly lower as a minimal supply cut by OPEC+ did little to offset fears of slowing demand in China.
Meanwhile, the U.S. relies on its Strategic Petroleum Reserve (SPR) to stabilize local gasoline prices, which surged to record highs earlier this year. This has seen the SPR fall to a 40-year low, with traders forecasting large gains in oil prices if the SPR draw is halted.
WTI daily chart remained negative to 80.90 while moving averages confirm the decline. However, the hourly chart shows fluctuation after hitting the resistance at $87 per barrel. Additionally, technical indicators show a high probability of a decline towards 84.90.
Pivot Point: 86.90
| SUPPORT | RESISTANCE |
| 85.95 | 87.50 |
| 84.70 | 88.40 |
| 83.50 | 89.65 |
Tags
Open Live Account
Please enter a valid country
No results found
No results found
Please enter a valid email
Please enter a valid verification code
1. 8-16 characters + numbers (0-9) 2. blend of letters (A-Z, a-z) 3. special characters (e.g, !a#S%^&)
Please enter the correct format
Please tick the checkbox to proceed
Please tick the checkbox to proceed
Important Notice
STARTRADER does not accept any applications from Australian residents.
To comply with regulatory requirements, clicking the button will redirect you to the STARTRADER website operated by STARTRADER PRIME GLOBAL PTY LTD (ABN 65 156 005 668), an authorized Australian Financial Services Licence holder (AFSL no. 421210) regulated by the Australian Securities and Investments Commission.
CONTINUEImportant Notice for Residents of the United Arab Emirates
In alignment with local regulatory requirements, individuals residing in the United Arab Emirates are requested to proceed via our dedicated regional platform at startrader.ae, which is operated by STARTRADER Global Financial Consultation & Financial Analysis L.L.C.. This entity is licensed by the UAE Securities and Commodities Authority (SCA) under License No. 20200000241, and is authorised to introduce financial services and promote financial products in the UAE.
Please click the "Continue" button below to be redirected.
CONTINUEError! Please try again.