Market News Summary
WTI (US OIL)
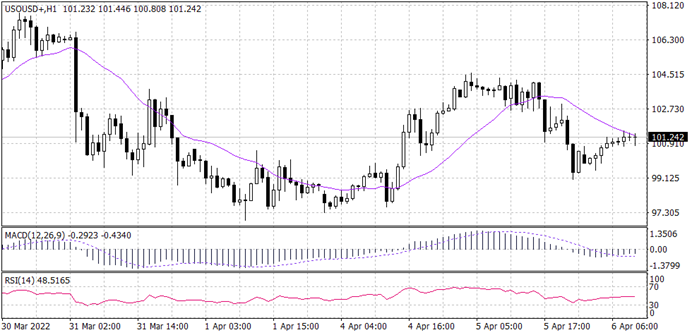
US crude oil (WTI) long-term trend is bearish. However, the price has intersected with the 20 candles MA at $101 a barrel. Fibonacci retracement shows a weak upward movement between the levels of 38.2 and 50, showing strong resistance below $102 a barrel. MACD and RSI show a likelihood of more downward movement towards $99.5 a barrel.
PIVOT POINT: 101.160
| S1 | S2 | S3 | |
| SUPPORT | 99.50 | 98.25 | 97.50 |
| R1 | R2 | R3 | |
| RESISTANCE | 101.50 | 102.00 | 103.20 |
Spot GOLD (XAUUSD)
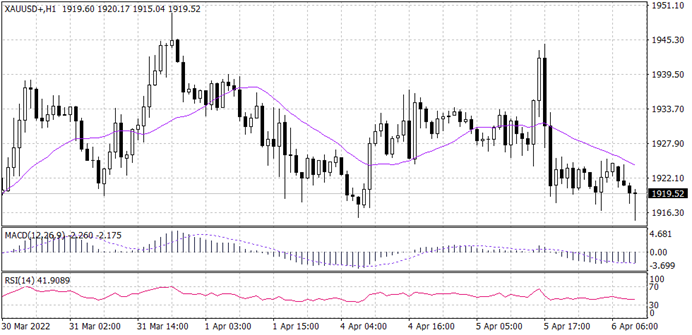
GOLD spot price seems to have changed its trend to bearish after breaking the upward trend line. It has retested the 20 Period moving average resistance level, which has an intersection with the support level of $1,925. Furthermore, the RSI and MACD signal a continuation of the downward trend.
PIVOT POINT: 1,919
| S1 | S2 | S3 | |
| SUPPORT | 1,925 | 1,928 | 1,933 |
| R1 | R2 | R3 | |
| RESISTANCE | 1,917 | 1,914 | 1,895 |
BTCUSD
Bitcoin’s overall trend looks to be bullish as it appears in the long-term chart. Meanwhile, the hourly time frame shows that the BTCUSD price is moving horizontally. Price is making a minor corrective move to the 20 EMA at 45,560. The MACD and RSI both signal a correction trend towards 44,600.
PIVOT POINT: 45,360
| S1 | S2 | S3 | |
| SUPPORT | 45,300 | 44,600 | 44,440 |
| R1 | R2 | R3 | |
| RESISTANCE | 45,430 | 45,600 | 46,000 |
GBPUSD
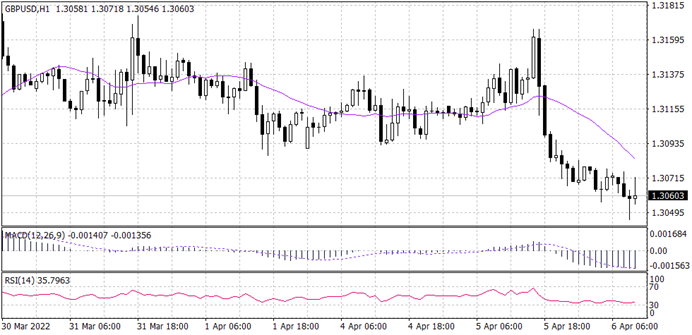
From the overview of price, cable’s overall trend looks bearish. In the hourly time frame price has recently broken the previous low and is likely to make a corrective move to the retest of the 20 candles MA before continuing its bearish direction. The MACD and RSI signaling a continuation towards 1.3050.
PIVOT POINT: 1.3060
| S1 | S2 | S3 | |
| SUPPORT | 1.3048 | 1.3000 | 1.2850 |
| R1 | R2 | R3 | |
| RESISTANCE | 1.3090 | 1.3120 | 1.3150 |
AUDUSD
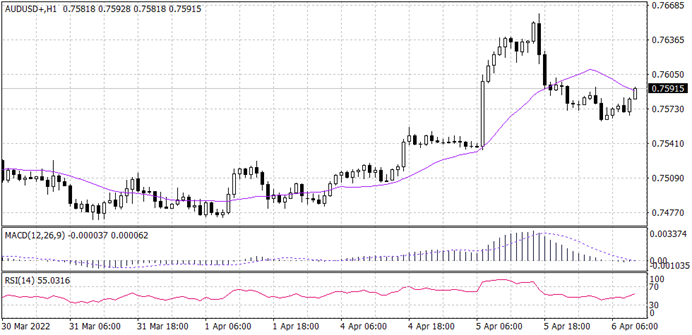
Aussie is showing a bullish trend in the long term against the greenback. however, the hourly time frame price is making minor lows to the downside. Technical indicators show a high possibility of a continuation of the bullish trend. Meanwhile, the 20 candles MA signals a slight correction towards 0.76050.
PIVOT POINT: 0.7590
| S1 | S2 | S3 | |
| SUPPORT | 0.7560 | 0.7540 | 0.7500 |
| R1 | R2 | R3 | |
| RESISTANCE | 0.7605 | 0.7620 | 0.7640 |
Tags
Open Live Account
Please enter a valid country
No results found
No results found
Please enter a valid email
Please enter a valid verification code
1. 8-16 characters + numbers (0-9) 2. blend of letters (A-Z, a-z) 3. special characters (e.g, !a#S%^&)
Please enter the correct format
Please tick the checkbox to proceed
Please tick the checkbox to proceed
Important Notice
STARTRADER does not accept any applications from Australian residents.
To comply with regulatory requirements, clicking the button will redirect you to the STARTRADER website operated by STARTRADER PRIME GLOBAL PTY LTD (ABN 65 156 005 668), an authorized Australian Financial Services Licence holder (AFSL no. 421210) regulated by the Australian Securities and Investments Commission.
CONTINUEImportant Notice for Residents of the United Arab Emirates
In alignment with local regulatory requirements, individuals residing in the United Arab Emirates are requested to proceed via our dedicated regional platform at startrader.ae, which is operated by STARTRADER Global Financial Consultation & Financial Analysis L.L.C.. This entity is licensed by the UAE Securities and Commodities Authority (SCA) under License No. 20200000241, and is authorised to introduce financial services and promote financial products in the UAE.
Please click the "Continue" button below to be redirected.
CONTINUEError! Please try again.