MARKET NEWS SUMMARY
Euro (EURUSD)
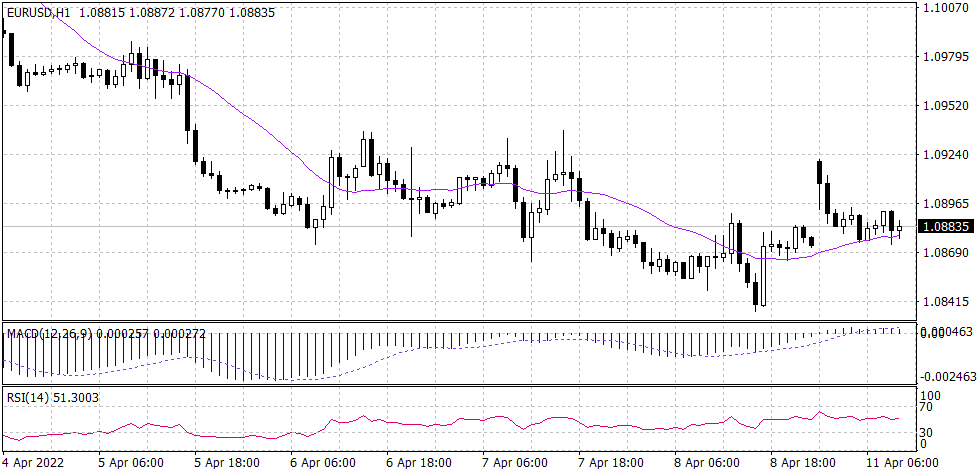
The long-term trend for EURUSD looks bearish. On the 1-hour time frame, the price seems to be making a series of lower lows, indicating a further decline. Price is currently trading below the 20 period MA at the level of 1.0895. The RSI and MACD both show that the price is most likely targeting 1.0640 in the long run.
PIVOT POINT: 1.0895
| S1 | S2 | S3 | |
| SUPPORT | 1.0850 | 1.0810 | 1.0770 |
| R1 | R2 | R3 | |
| RESISTANCE | 1.0940 | 1.0980 | 1.1030 |
Ethereum (ETHUSD)
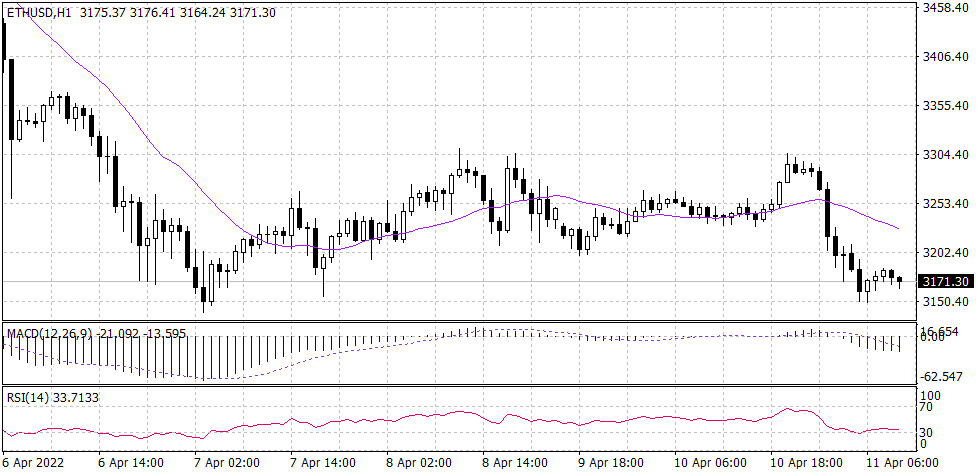
The ETHUSD price trend on the daily time frame is bullish. However, in the hourly time frame, the price has been making sharply lower lows ending near 3,150. The price is likely to make a pullback to the level 3,210 which is in intersection with the 20 period MA and the Fibonacci level of 38.2 and 50. In technical indicators, the RSI shows that ETHUSD is oversold which may lead to a possible reversal of price to the upside.
PIVOT POINT: 3,160
| S1 | S2 | S3 | |
| SUPPORT | 3,115 | 3,065 | 3,005 |
| R1 | R2 | R3 | |
| RESISTANCE | 3,210 | 3,260 | 3,310 |
Sterling Pound (GBPUSD)
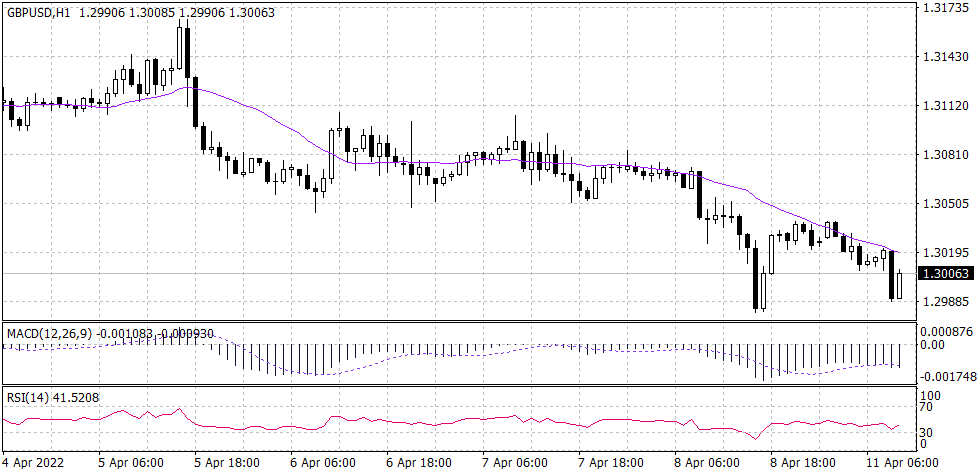
The overall trend for the GBPUSD from the daily time frame looks bearish. Similarly, the hourly time frame shows the price moving to lower lows. Price is trading below the 20-period moving average, while the RSI and MACD both show that the price is in a continuous trend to the downside.
PIVOT POINT: 1.3020
| S1 | S2 | S3 | |
| SUPPORT | 1.2995 | 1.2930 | 1.2890 |
| R1 | R2 | R3 | |
| RESISTANCE | 1.3040 | 1.3060 | 1.3080 |
Spot Gold (XAUUSD)
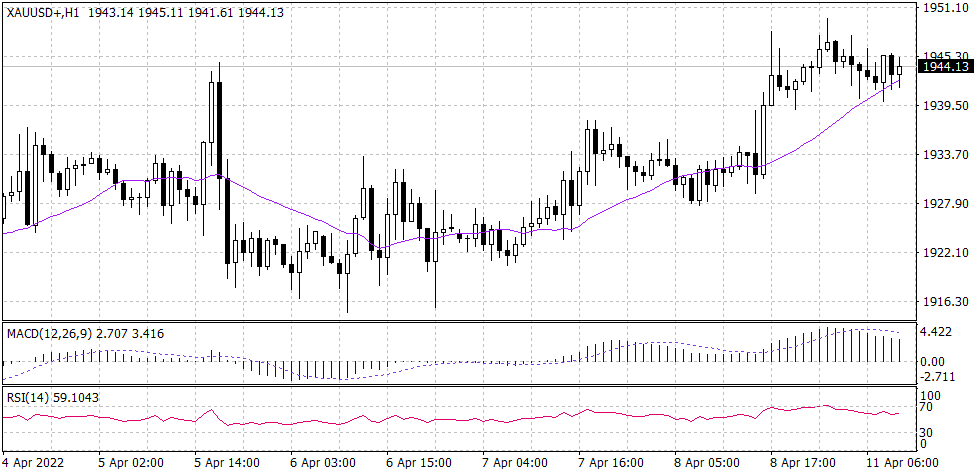
GOLD SPOT price has been moving horizontally from the daily time frame. Furthermore, in the hourly time frame price is also moving horizontally. The breakout from the horizontal movement of price will give Gold Spot a significant direction. The RSI and MACD are moving within the centre-line which indicates a horizontal movement of price.
PIVOT POINT: 1,940
| S1 | S2 | S3 | |
| SUPPORT | 1,940 | 1,930 | 1,920 |
| R1 | R2 | R3 | |
| RESISTANCE | 1,945 | 1,950 | 1,960 |
S&P 500 (SPX500)
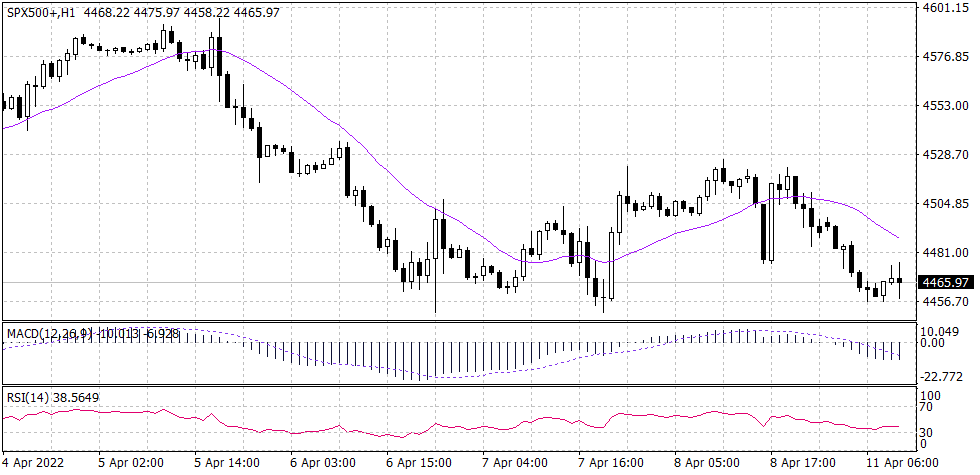
The overall trend for SPX500 looks bullish. However, from the hourly time frame price has been moving to the downside. Price is currently at a level of 4,458 which could lead to a possible pullback to the 20 period MA before continuing to the downside. The RSI and MACD technical indicators both show price continuation to the downside.
PIVOT POINT: 4,458
| S1 | S2 | S3 | |
| SUPPORT | 4,440 | 4,420 | 4,400 |
| R1 | R2 | R3 | |
| RESISTANCE | 4,480 | 4,500 | 4,520 |
Tags
Open Live Account
Please enter a valid country
No results found
No results found
Please enter a valid email
Please enter a valid verification code
1. 8-16 characters + numbers (0-9) 2. blend of letters (A-Z, a-z) 3. special characters (e.g, !a#S%^&)
Please enter the correct format
Please tick the checkbox to proceed
Please tick the checkbox to proceed
Important Notice
STARTRADER does not accept any applications from Australian residents.
To comply with regulatory requirements, clicking the button will redirect you to the STARTRADER website operated by STARTRADER PRIME GLOBAL PTY LTD (ABN 65 156 005 668), an authorized Australian Financial Services Licence holder (AFSL no. 421210) regulated by the Australian Securities and Investments Commission.
CONTINUEImportant Notice for Residents of the United Arab Emirates
In alignment with local regulatory requirements, individuals residing in the United Arab Emirates are requested to proceed via our dedicated regional platform at startrader.ae, which is operated by STARTRADER Global Financial Consultation & Financial Analysis L.L.C.. This entity is licensed by the UAE Securities and Commodities Authority (SCA) under License No. 20200000241, and is authorised to introduce financial services and promote financial products in the UAE.
Please click the "Continue" button below to be redirected.
CONTINUEError! Please try again.